During the semiconductor manufacturing process, contamination can be introduced from the air, equipment, cleanroom personnel, process water, process chemicals, and process gases.1 Careful identification of the contaminant source is required to best identify mitigation strategies that utilize filtration. Installing a filter can reduce defectivity, but this mitigation strategy will not indefinitely protect a gas stream from contamination.
Filters are often chosen when equipment is first installed, however that equipment may be used for many different process nodes, which could change filtration requirements. The filter chosen for one process node may not be the most efficient option and change-out during preventive maintenance activities are frequently overlooked.
Entegris has worked with multiple partners to understand the impact age has on gas filter performance. The result of these evaluations is filter replacement schedule guidelines that mitigate filter failure and particle excursions. Table 1 summarizes these guidelines.
Table 1. Gas filter changeout guidelines
| GAS TYPE | < 1 PPM H2O | >1 PPM H2O |
| Process Gas | 1 – 3 years | < 1 year (corrosive) |
| Inert Gas | 5 – 7 years | 1 – 3 years |
| HMDS | < 1 year |
Entegris has collected significant historical data to understand gas filter failure and make recommendations about smart filter replacement. The case study highlighted below shows how filtration efficacy can decline over time. Therefore, management of gas filter changeout should be considered on a gas-by-gas basis and when equipment is extended for use into new technology nodes.
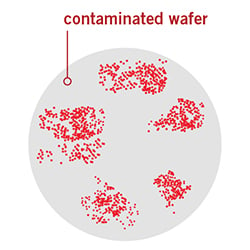
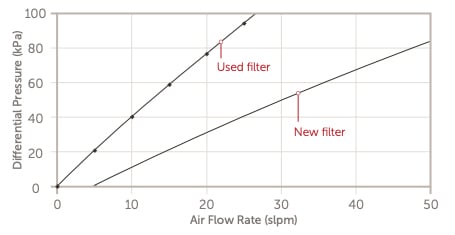
In this case study, a gas filter was used for hexamethyldisilazane (HMDS) on a photolithography track for over three years. It was ultimately removed from the track when defect inspection results, like those in Figure 7, were observed by the user. When this filter was tested for pressure drop after it was returned, it was again obvious that the performance had significantly deteriorated over time (Figure 8).
|
Figure 7. Wafer map resulting from the continued use of a gas filter beyond its useful life. Source: Entegris |
|
Figure 8. Pressure drop testing comparing a used (three years) filter and a new filter. Source: Entegris |
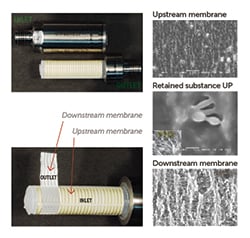
Figure 9 further confirms the pressure drop and on-wafer data. The images on the left show another distinct color difference of the membrane between the inlet and outlet portions, indicating that the filter had been saturated with contaminants. The SEM images on the right show significant contamination on the upstream side of the membrane. In this case, no defects were observed on the downstream portion of the membrane.

Figure 9. (Left) images used of the filter analysis showing the differences in color of the membrane between the upstream and downstream side. (Right) SEM images of the upstream and downstream portions of the membrane, including contamination on the upstream side of the membrane. Source: Entegris. |
An increase in pressure drop or a reduction in filter efficiency are common phenomena in gas unit processes. Recognizing the signs of possible failure is sometimes difficult as systems become increasingly automated. Particle excursions can occur when automated gas delivery systems increase inlet pressure beyond a manufacturer’s specification. Secondary effects may also include increased utility expense and reduced gas delivery equipment lifetimes as a result of back pressure from clogged or clogging filters.
Incorporating routine gas filter replacement into your preventive maintenance programs can increase gas purity and reduce the risks associated with contaminants reaching the wafer surface.2
References
1 Mark Jamison, 300 mm Wafer Fab Contamination Control, HDR Architecture, Inc.
2 Eliminating Unwanted Oxygen: Preventing Device Failure at the Source, Entegris, Inc.
Learn more at https://www.entegris.com/gas-filters


